
In December 2024, we launched the LinkedIn Unwrapped - which is a 12 page report that documents your 2024 on LinkedIn.
Over 100,000 of you from around the world downloaded it, and the response was overwhelming and incredibly exciting. LinkedIn was flooded with people sharing their Unwrapped reports, celebrating their growth, and inspiring their networks.
But Unwrapped was just the beginning. It was actually a prototype of something much bigger — something we’ve been planning for months: Stats.
The problem with traditional analytics
There's loads of tools that do analytics. But the problem with having lots of data is it can be really overwhelming really fast. Hence you might even hire someone to look into your data and recommend strategies / highlight key trends.
That's why we're building Stats
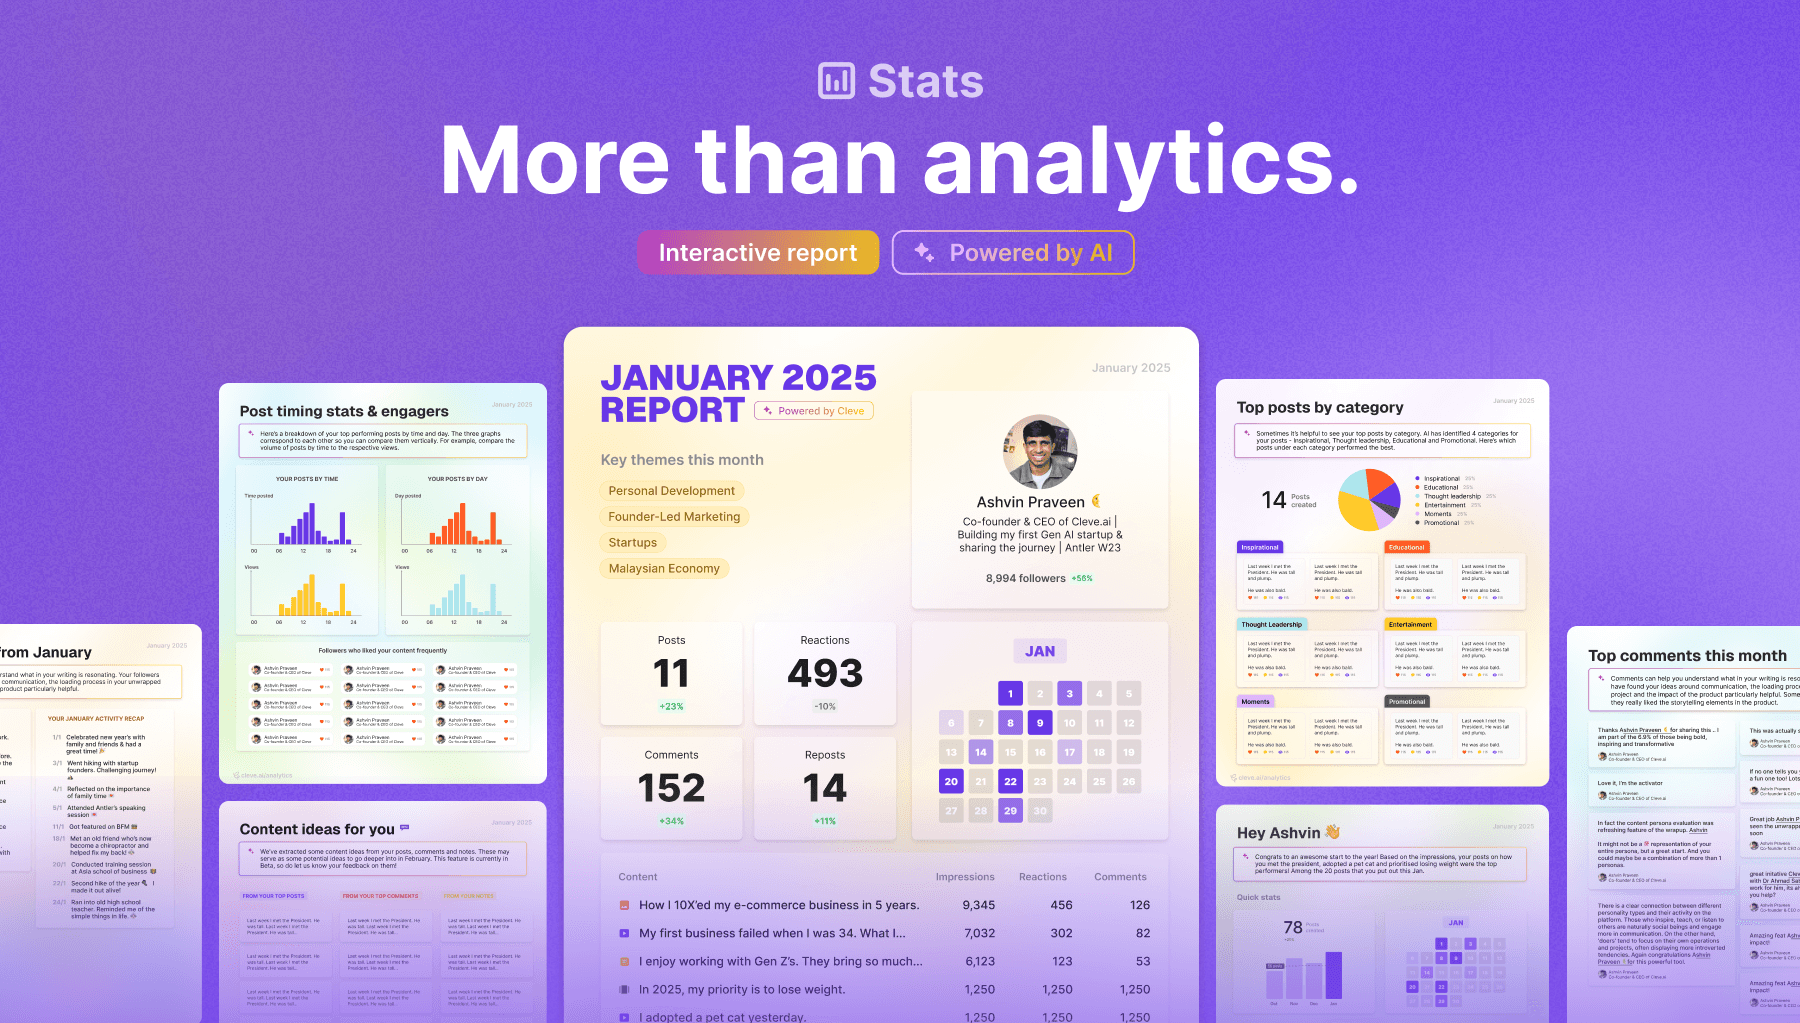
Stats is designed to help you understand your data and analytics in minutes so you can have the clarity you need to grow your channels optimally.
At the start of each month, you'll receive an interactive Stats report wrapping up the previous month.
These are designed ground up with Artificial Intelligence, so it's almost like having a human data analyst sift through the numbers and present your month's growth.
And it's going to be free for Cleve Pro and Lite users
If you're already a subscriber of Cleve Pro or Lite plans, you'll automatically get Stats. You'll see a Stats page right in your Cleve space.
If you're not yet subscribed, you can still first explore your LinkedIn Unwrapped in your Stats page in Cleve for free, and consider upgrading to view your monthly Stats reports.
Cleve plans start at $10/month, and you can get 20% off all plans with our Stats launch offer (Use Code: STATS20 at checkout)
The full Stats story
At Cleve.ai we believe in a future where millions more people will be sharing their ideas, experiences and knowledge at scale in the form of content. We’ve been building a series of hyperpersonalised AI tools to make this easier.
We started with content generation, then note-taking, AI editing, content ideation and we’ve wanted to extend that to analytics and data, to be as helpful as possible to business leaders who are trying to build their brand in limited time.
In December we were thinking of building the analytics module (Stats), though while we were designing it, Spotify Wrapped came out and we thought - Hey we could probably launch Stats in a similar way.
This led to the design of the #LinkedInUnwrapped campaign that went on to get 100k downloads in 4 weeks.
Designing the #LinkedInUnwrapped had a lot of interesting constraints. It was engineered for virality, so the primary design goal was creating something that would be shareable and fun. We had a number of other pages that we initially designed for but left out in the final version, as while they’d be helpful to the user, they might not be as shareable or interesting to their audience.
With Stats things are different. Our only design goal and what we’re optimising for is being as useful as possible to the user, and providing the key insights that would help people with their brand & content journey. This led to lots more innovations with the additional freedom.
Designing Stats
We started the design process in the first week of January and reached out to our Pro and Lite users to hop on calls to understand their challenges. Every week I’d have two days blocked off my calendar just for this. At the same time, we scoured hundreds of forums and articles to understand what people were looking for.
We then designed iteratively to incorporate the user requests into the design, alongside things that intuitively made sense to us as creators ourselves. We iterated for hours on the data visualisations, prompt engineering and design, got early feedback from users and kept repeating this rapid iteration cycle.
And we’ll continue iterating even after the first reports are released later today so do send in your feedback too for subsequent reports :)
Stats will roll out to all Cleve Lite and Pro users automatically later (you’ll see a Stats tab in your Cleve dashboard).
👉 Learn more about Stats at https://cleve.ai/stats
PS. stats is just the first of a series of major updates coming in 2025. Stay tuned, sooo excited for some of the next ones too ✌️

